Businesses that add focused AI forecasts report up to a 40% cost drop and 30% productivity lift. This guide shows how predictive analytics and computer vision fit real small-business budgets in 2026 and what results you can expect.
Start with one clear prediction, clean the few fields that drive it, and run a 30-day pilot to prove value. Then, fold the model into your daily workflow. That’s the path I’ve used with dozens of owners who needed results without hiring a data team.
You’ll get plain-language use cases, a step-by-step rollout plan, common pitfalls to avoid, and tools that match your skills and data size. You’ll also see where computer vision fits next to classic spreadsheets and dashboards.

What Predictive Analytics AI Actually Does for Small Businesses
Predictive analytics means using past data to make a simple, testable guess about the near future. You don’t need a lab. You need clean rows and a question worth money. With the right setup, predictive analytics platforms point you to the next best move and flag risk before it bites.
Consider four everyday wins:
- Demand forecasting: A local bakery with 12 SKUs forecasts next Friday’s orders by SKU using the last 60 days plus weather. As a result, they cut next-day waste by 18 loaves and avoid six stockouts in a month.
- Churn prediction: A gym with 480 members flags 35 “at-risk” accounts (late visits + support tickets). Therefore, they send a free class offer and keep 19 of them. That’s ~$950 in saved monthly revenue.
- Cash flow modeling: A design studio maps invoice dates and payment lags. Consequently, they predict a $17,200 gap three weeks out and shift two vendor bills to stay in the black.
- Inventory tuning: A hardware store links POS sales to supplier lead times. As a result, they raise min-stock for six items by 10 units and reduce emergency reorders from five per month to one.
Where computer vision fits your floor
Computer vision reads images or video to add live signals to your forecast. For example, a café counts foot traffic with a doorway camera, then adjusts staff schedules for rush times. In retail, a shelf camera flags “facing” gaps so you restock before the dinner rush, which boosts same-day sales. You can start with a single camera feed and one alert.
“Businesses implementing AI services report up to a 40% reduction in operational costs and 30% increase in productivity.” — Internal results from GlobussoftAI OpenClaw Services (2026)
Small-business examples that pay back fast
- A florist sets a two-week Mother’s Day model that blends last year’s sales, heat index, and day-of-week. Result: 9% more bouquet availability with no extra spoilage.
- A niche ecommerce shop runs a weekly return-rate model by SKU, then fixes the three worst product pages. Therefore, returns drop 12% the next month. For more sector detail, see this ecommerce playbook.
For a deeper background on methods like regression and classification, this short Predictive analytics overview (Wikipedia) is a useful primer.
Also Read!
Best Self-Hosted AI Agent Setup for Small Businesses in 2026
OpenClaw vs n8n for Ecommerce: Which Is Better for Self-Hosted AI Agent Setup?
How to Choose and Implement a Predictive Analytics Tool — Step by Step
You don’t need 50 features. You need a clear goal, a clean sheet, and a 30-day test that fits your calendar and budget. Keep your scope small and your checks tight.
Step 1: Audit your data (2 hours, then 1 hour clean-up)
List the columns you trust today: date, product, units, price, customer ID, channel, invoice status, visit count. Then, spot holes. Missing dates?
SKU codes split across formats? Fix only the fields that affect your goal. Keep a “data dictionary” in a shared doc so your team knows what each field means.
Step 2: Define one prediction goal
Pick one yes/no or number forecast tied to dollars or hours. Examples: “Will this subscriber churn in 30 days?” or “How many units of SKU-14 will sell next Friday?” Write the success metric now: “We win if MAE < 15 units” or “Keep 10+ customers at risk this month.
Step 3: Set a realistic budget
Set time and cash limits up front. A practical starter stack runs cheap: free core framework, a small VPS around $5/month, and total under $10/month including light model use. Keep 80% of the budget in staff time to clean data and test alerts. Document this in one page.
Step 4: Evaluate tools on ease of use, not features
Score tools on three questions: Can you connect your data in under 60 minutes? Can a non-technical teammate run a forecast and read it? Can it send results to your current tools (email, Slack, spreadsheet)? Favor simple predictive analytics platforms over feature sprawl. If you plan to add cameras later, check that it can accept a “count by hour” feed from a basic vision service.
Step 5: Run a 30-day pilot
Freeze the goal. Freeze the fields. Then, run weekly forecasts and log results.
Compare to a “naive” baseline (e.g., last week = next week). If the model beats baseline by 15–20% and people use the alerts, you’ve got a keeper. Add a midpoint check on day 15 to fix obvious data issues.
Step 6: Measure ROI and decide
Tally savings and gains in dollars and hours. For example, $420 less waste, $950 saved revenue, 6 staff hours back. If ROI is positive, wire it into your workflow. If not, change the goal or stop. Remember, small wins stack.
Keep predictive analytics simple
You’ll be tempted to add more signals. Resist it. Fewer fields make cleaner models that are easy to debug, maintain, and hand off. If you include cameras, start with one counter (entries per hour) before trying image classification.
 , and a checkmark; friendly mentor tone)
Additionally, if you want help scoping the roadmap or plugging models into your stack, tools with AI/ML consulting and smooth integration services can save weeks. This is where managed partners shine: they map your data, connect CRMs and analytics tools, and keep the pilot tight so you learn fast without breaking workflows.
Start a low-cost pilot today →
5 Mistakes Small Businesses Make with Predictive Analytics
Even smart teams hit the same traps. Here’s how to spot and fix them before they cost you time.
Mistake 1: Buying enterprise tools you won’t use
Big platforms can look safe. But you’ll pay for features you won’t touch for years. Instead, pick a tool you can run this week and scale later. Ask for a 30-day plan, not a 3-year roadmap.
Mistake 2: Skipping data cleaning
No model can fix messy SKUs or missing dates. Clean the 3–5 fields that drive your goal before you click “Train.” Create one rule for each field (e.g., SKU = three letters + dash + 3 digits) and enforce it at the point of entry.
Mistake 3: Trying to predict everything at once
Forecasts fail when the question is fuzzy. Focus on one. Win it. Then stack the next one. For example, run churn first; add upsell next month.
Mistake 4: Ignoring integration with existing workflows
A forecast no one sees is useless. Send alerts where your team already lives: email, chat, or your POS. Plan the hand-off: who gets the alert, what they do, and how they confirm done. System integration with CRMs and analytics tools should be a checkbox, not a project.
Mistake 5: Treating AI as “set and forget”
Models drift. Products change. As a result, performance slides if you never check it.
Add a monthly 30-minute review. Retrain when error rises above your threshold. Performance optimization is a routine, not a rescue mission.
| Mistake | Quick fix |
|---|---|
| Overbuying | Choose a tool you can deploy in 7 days |
| Dirty data | Standardize the 3–5 key fields first |
| Scope creep | One forecast, one metric, 30 days |
| No integration | Deliver results into current tools |
| Set-and-forget | Schedule a monthly model check |
Mentioned once per section, predictive analytics and computer vision can fit each fix: keep data tidy, pick one goal, and wire outcomes into daily work so teams act on them.
Also Read!
How to Set Up a Self-Hosted AI Agent for Your Ecommerce Store
Healthcare Organization’s Guide to Choosing a Predictive Analytics AI Tool
Predictive Analytics Tools Worth Evaluating in 2026
You have good options across no-code, spreadsheets, open-source, and managed services. Choose by your data size, skills, and how fast you need to plug into your stack.
Choosing predictive analytics platforms
- Obviously AI (no-code): Upload a CSV, pick a target, and get a model in minutes. Price scales by data size and seats. Skill: non-technical. Data: tidy columns.
- Pecan (no-code): Built for business teams with pipelines to common data sources. Price: commercial. Skill: business analyst. Data: cloud warehouses.
Spreadsheet-friendly:
- Akkio: Works well for spreadsheet users who want point-and-click predictions and live dashboards. Price: commercial tiers. Skill: spreadsheet power user. Data: tabular, tidy.
Open-source:
- Prophet (by Meta): Time-series forecasting for daily/weekly/seasonal patterns. Price: free. Skill: basic Python or R. Data: timestamp + value, clean seasonality.
Service-based and managed:
- GlobussoftAI OpenClaw Services: A managed option if you want deployment, AI/ML pipeline development, and custom workflows done for you. You get machine learning models, custom development for AI-driven reporting, and Managed AI Operations with end-to-end encryption and role-based access controls. Pricing starts with a free core framework, and a typical VPS runs about $5/month with total costs usually under $10/month.
If you sell online, this ecommerce guide walks through merchandising and returns models step by step. For finance teams, these fintech examples for 2026 show fraud and risk scoring in real workflows.
Adding computer vision the simple way
Start with one count: entries per hour or shelf gap detection. Feed that count into your forecast as a feature. You don’t need to process raw video inside your store systems; a small edge device or managed service can emit clean hourly numbers your model can use.
 , skill level, and data needs; icons for no-code, spreadsheet, open-source, and managed service; approachable small-business style)
As social proof, OpenClaw’s open-source base reached 100,000 GitHub stars in under eight weeks and has over 1,000 hours of testing data behind it, which signals active use and rigorous validation. On security, the stack supports encrypted data flows and access controls, so you can keep forecasts and customer data locked down.
Moreover, if you plan to add sensors or cameras later, confirm that the service supports computer vision applications and can accept simple numeric feeds from a camera counter. That keeps your “predictive analytics and computer vision” plan on one track.
Key Takeaways and What to Do This Week
Before the next quarter, you can get a model live, a team using it, and a result you can show on one slide. Keep it small, clear, and wired into your daily tools.
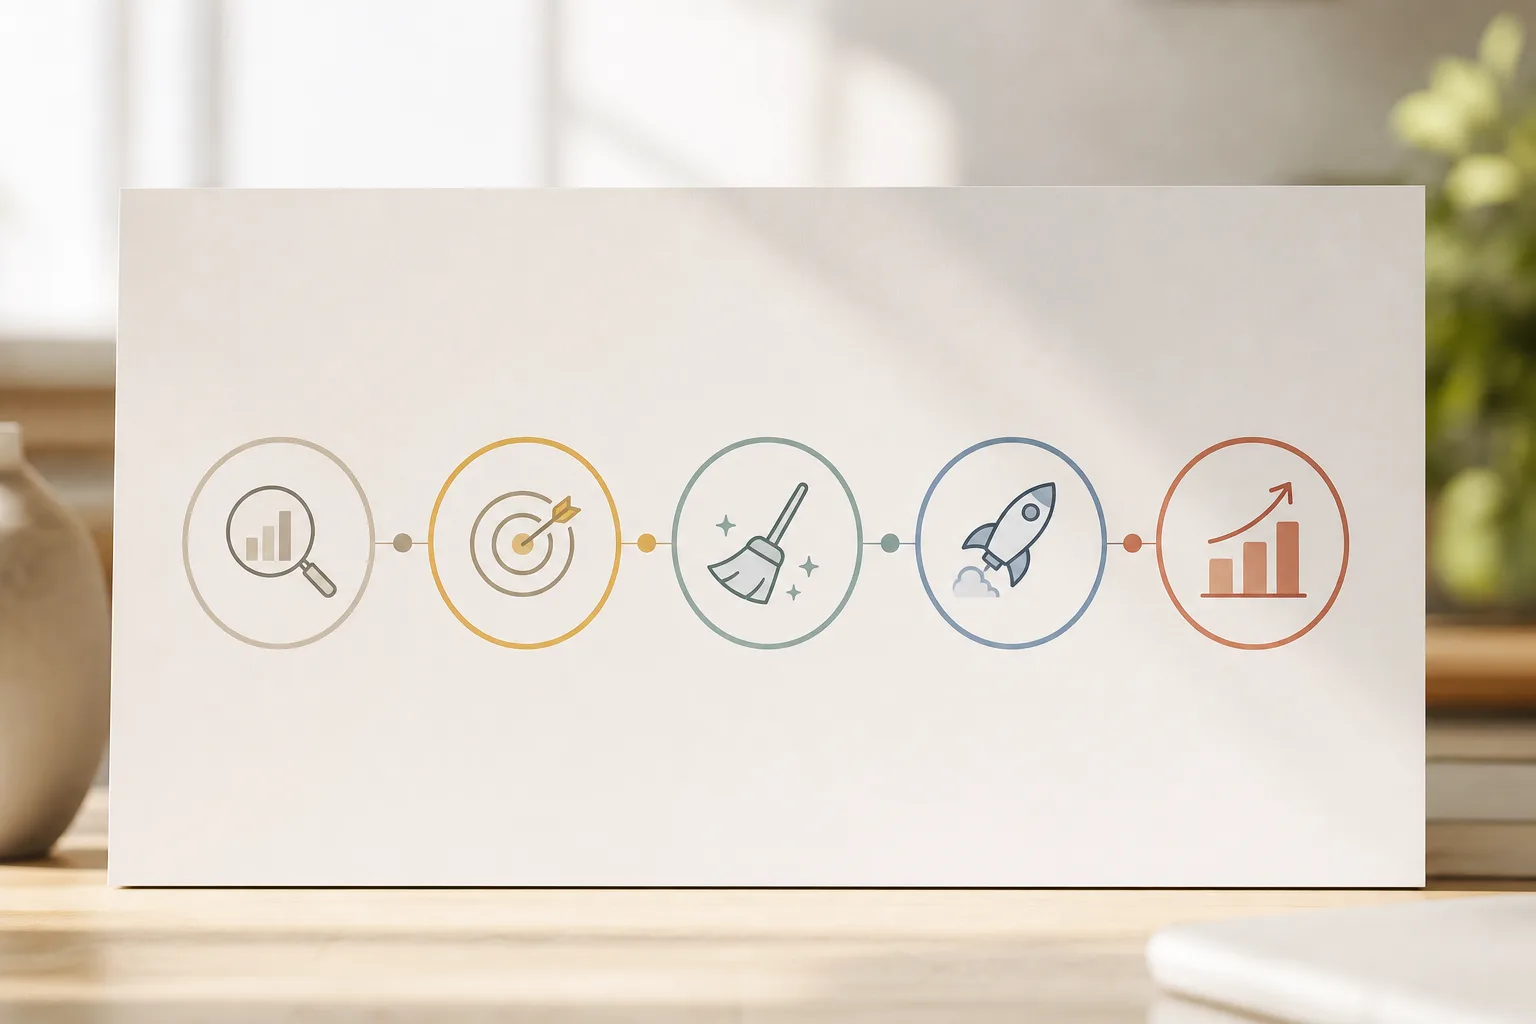
- Start small and specific. One forecast, one metric, 30 days.
- Clean the few fields that move the result. Don’t scrub the entire warehouse.
- Test against a naive baseline to prove gains.
- Deliver results into current tools so people act.
- Plan for computer vision later by adding simple counts first.
This week’s 7-day plan:
- Day 1–2: Audit one data source (POS exports or CRM), list fields, standardize date and ID formats. – Day 3: Write one prediction question and one success metric. – Day 4–5: Trial one free or low-cost tool on a sample (500–5,000 rows). Log baseline and model results. – Day 6: Route results into email or a shared sheet.
Decide who acts on alerts. – Day 7: Review error vs. goal. Keep, tweak, or stop.
If you need a partner to scope, connect, and run the first pilot, pick a managed option that offers consulting, integration, and secure operations. That way, predictive analytics and computer vision become a steady habit, not a stalled side project.