

Up to a 40% cut in costs and a 30% productivity lift are on the table for teams that get AI right. In ecommerce, predictive analytics and computer vision deliver those gains only when the tool fits your data and stack.
The fastest way to choose is to define one measurable prediction (e.g., “predict 7‑day demand per SKU per DC”), audit your data for coverage and freshness, and run a one-week proof on your own events. Tools differ, but your data and process decide the win. This 2026 guide shows you what to check, how to test, and where buyers slip.
For context, predictive analytics estimates future outcomes from past signals; Predictive analytics is not magic and requires solid inputs. You’ll see better lifts by pairing it with image understanding to enrich product and content data. That is where computer vision helps with attributes and quality control.

What Predictive Analytics Actually Does for Ecommerce (And Why Most Stores Get It Wrong)
You care about sell-through, margin, and cash tied in stock.
Predictive models help you act before problems hit.
In practice, predictive analytics and computer vision power four core workflows: demand forecasting, churn prediction, dynamic pricing, and product recommendations.
Core workflows
- First, forecasting. You can predict 7-, 14-, and 28‑day demand by SKU, channel, and fulfillment node. Then you align buys, inbound, and transfer plans. If you run 18,000 SKUs with long-tail demand, even a 3% error drop can free six figures of working capital in a quarter.
- Second, churn prediction. By scoring each customer’s risk and likely next buy, you can send fewer, smarter messages. For example, you might re-activate lapsed buyers of size‑8 shoes with one offer, not five blasts. That reduces spend while lifting repeat rate.
- Third, dynamic pricing. With price elasticity curves and inventory pressure, you can adjust price bands within set guardrails. Think clearance for overstocked variants, not site‑wide cuts. The gains show up as fewer stockouts and a steadier gross margin.
- Fourth, recommendations. Better catalog tags make smarter slots: “pair with,” “complete the look,” and “similar styles” that reflect real patterns. Here, computer vision helps infer color, style, and quality from images at scale, so your model sees more than text.
What it is — and what it is not
Predictive analytics is applied statistics and ML that turn your history into next-best actions. It is not a replacement for judgment, brand, or merchandising craft. It is only as good as your data coverage, labeling, and freshness. And it is not plug-and-play; you still set goals, constraints, and guardrails.
Most stores get it wrong by jumping to a “smart” tool before cleaning events, mapping IDs, and defining the decision they want to influence. The result is noise, not lift. Instead, scope one use case (e.g., 5,000 SKUs with seasonal swings), prove lift, and expand.
Step-by-Step Framework for Evaluating Predictive Analytics AI Tools
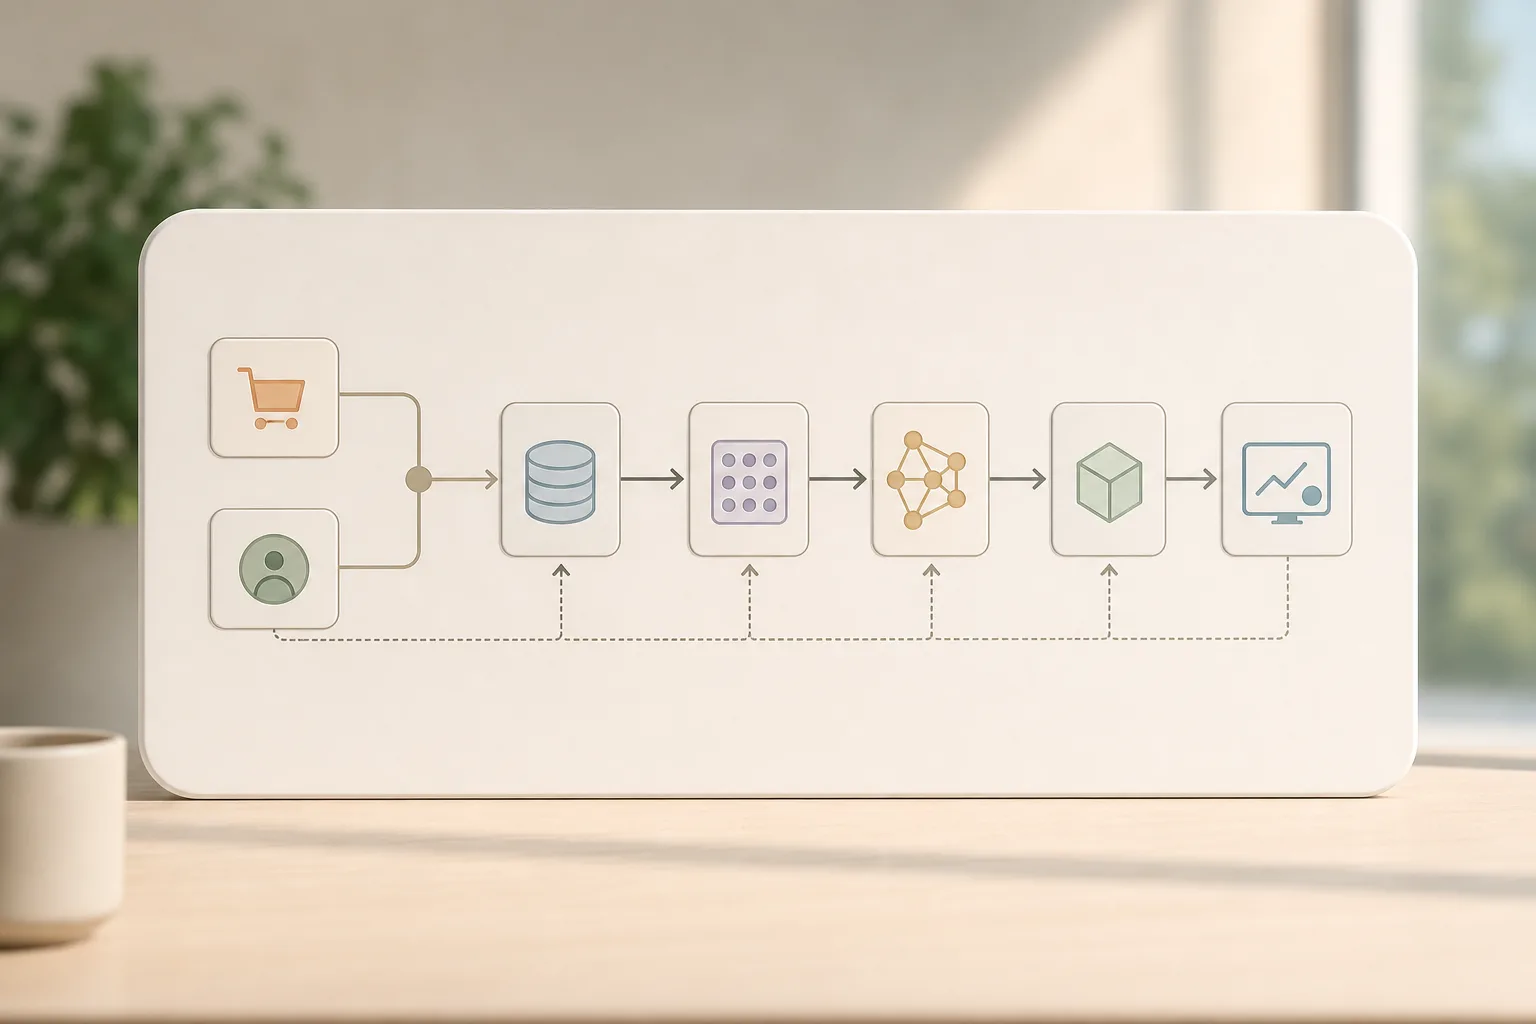
Here’s a 7‑step path I use with ecommerce teams to pick a tool in under two weeks. Follow it and you’ll avoid months of rework. You’ll also see where predictive analytics and computer vision add the most value in your stack.
-
Audit your data readiness
Check joins across order, product, traffic, and inventory tables. Confirm event freshness (e.g., order events ≤15 minutes lag). Sample 100 SKUs; compare text, images, and variants for gaps. -
Define prediction goals
- Write one sentence: “Predict X to decide Y and measure Z.
- Example: “Predict 14‑day churn to trigger a winback and measure net revenue per recipient.
Integration and transparency
-
Assess integration with your stack
Map how the tool writes scores back to your CDP, ESP, and BI, and confirm how those values flow into campaigns and reports. Ask for “smooth integration services to fit AI solutions into existing systems. -
Check model transparency
Require feature importance, SHAP-like views, and clear guardrails. Demand edit controls for excluded features and bias checks. -
Test accuracy, with your data
- Use a backtest plus a live A/B.
- Track precision/recall for classification and MAPE/MAE for demand.
Scale and cost
-
Evaluate scalability
Ask how they handle spikes, retrains, and drift, and review SLOs around latency and throughput. Look for “AI/ML pipeline development for scalable deployment” and “Scalability planning for long-term growth. -
Compare total cost of ownership (TCO)
- Add tool fees, cloud, people time, and integration.
- Model 12 months: pilot, expand, and steady-state support.
What good accuracy looks like (and how to measure it)
For demand, MAPE under 25% on long-tail SKUs is strong, and under 15% on the top 10% SKUs is a good sign. For churn, focus on precision at the budgeted send volume, not just AUC. For price, simulate margin vs. sell-through under your constraints and measure regret.
“Test case structuring in a hierarchical manner for clarity and reduced debug time” and “Includes run-comparison tooling for benchmark creation” are practical phrases you want to see in any vendor’s QA story.
Get an instant audit checklist →
Also Read!
GlobussoftAI OpenClaw vs HubSpot AI for Ecommerce: Which Is Better for AI CRM Integration?
How to Choose and Integrate an AI CRM for Your Ecommerce Store
5 Common Mistakes Ecommerce Teams Make with Predictive Analytics
Even strong teams hit the same five traps. Avoid them and you’ll see lift faster from predictive analytics and computer vision.
- Treating it as plug-and-play
- You buy a tool and skip goal-setting. Then the dashboard looks “smart” but changes no decision. Write the one-sentence goal first.
- Ignoring data quality
- Orders lack source/medium, SKUs miss size/color, and product images are inconsistent. Vision-driven tagging can fill gaps, but only if IDs match.
- Over-relying on a single metric
- Chasing AUC looks great in slides, but your winback budget cares about precision at K. Tie metrics to spend and margin, not just score stats.
- Skipping A/B validation
- Backtests can mislead if promotions or supply shocks skew history. Always run an A/B for 2–4 weeks on one use case before rollout.
- Choosing tools without integration support
- Scores trapped in a vendor UI help no one. Ask for “AI/ML consulting to build roadmaps and implement solutions” and ensure writes back to your ESP and BI.
Businesses implementing AI services report up to a 40% reduction in operational costs and 30% increase in productivity. Use that headroom to fund your data cleanup and a focused pilot, not to add three more tools.
As you fix these, insist on model training and fine-tuning on domain-specific data. For example, if you sell 12,000 apparel SKUs with high returns, include post‑return events in features. That’s where a 2–3% conversion lift and fewer restocks can stack into real margin.
Tools and Platforms Worth Evaluating in 2026
You have three practical lanes in 2026: SaaS platforms, cloud-native services, and deployment services for custom pipelines. The right lane depends on team skills, volume, and how much you need to blend catalog text with images using computer vision.
SaaS predictive platforms (Pecan, Obviously AI)
This lane fits lean teams wanting speed on common tasks like forecasting, churn, and LTV. Setup is typically faster thanks to built-in connectors and ecommerce templates, so you can move from data to tests quickly. The trade-off is limited control and more friction when blending niche features or enforcing strict price rules, which can matter for complex catalogs.
Cloud-native ML (AWS Forecast, Google Vertex AI)
This lane fits data teams that want control and scale on their cloud. You get flexible modeling, versioning, and MLOps with access to broader AI services, which helps when you need custom feature stores or vision models. The watch-out is higher setup cost because you own the data engineering, deployment, and monitoring end to end.
Deployment services for custom pipelines (one mention)
- One option: tools like GlobussoftAI OpenClaw Services, which focus on secure, scalable deployment plus integration with CRMs and analytics tools. You get custom development for workflow automation and AI-driven reporting, end-to-end encryption and role-based access controls for security, and a free core framework where typical VPS costs are about $5/month (total costs usually under $10/month with AI model usage). If you need strict guardrails or bespoke vision tagging, this lane pays back.

For cross‑industry lessons on risk scoring and model guardrails, this overview of predictive analytics and computer vision fintech 2026 shows how strict controls translate well to ecommerce price and fraud decisions.
As a final check, ask each vendor to explain how they support “Performance optimization to ensure process efficiency” when demand spikes, and how they handle access control across marketing, planning, and BI. Security-focused setup matters because your pricing, promotions, and inventory plans sit behind these tools.
Key Takeaways
- Start with one clear decision to improve, not a bundle of dashboards.
- Clean joins, fresh events, and consistent images beat fancy models.
- Test accuracy on your data and tie metrics to budgeted actions.
- Pick a platform lane that matches your team and control needs in 2026.
- Treat security and integration as must-haves, not add‑ons.
What to Do This Week: Your Predictive Analytics Action Plan
Day 1.
- Pull a 90‑day slice. Check joins across orders, products, traffic, inventory, and images. Flag missing IDs, stale events, and inconsistent variants.
Day 2.
- Pick one: demand (per SKU/DC), churn (7/14 days), or price banding. Write the goal: “Predict X to decide Y and measure Z.
Day 3.
- Include one SaaS, one cloud-native, and one deployment service. Confirm write‑back to your CDP/ESP/BI and role-based access controls.
Day 4.
- Train on last 6–12 months. Backtest plus a small A/B. Track the metric that maps to spend or stock (e.g., MAPE, precision@K).
Day 5.
- Compare results and TCO. Note risks, guardrails, and a 90‑day rollout plan. Share a one‑page brief with owners and timelines.

As you lock the plan, remember that predictive analytics and computer vision work best when they live in your daily flow. Feed scores into the tools your team already uses, and keep a simple review rhythm so models don’t drift in silence.